Congratulations — you’re one step closer to better work.
You’ve uncovered where inefficiency hides. Now turn those insights into action.

Delivered instantly and sent to your inbox.
- Personalized results by department and process
- ROI benchmarks to prove efficiency gains
- Action steps to reduce time, cost, and errors
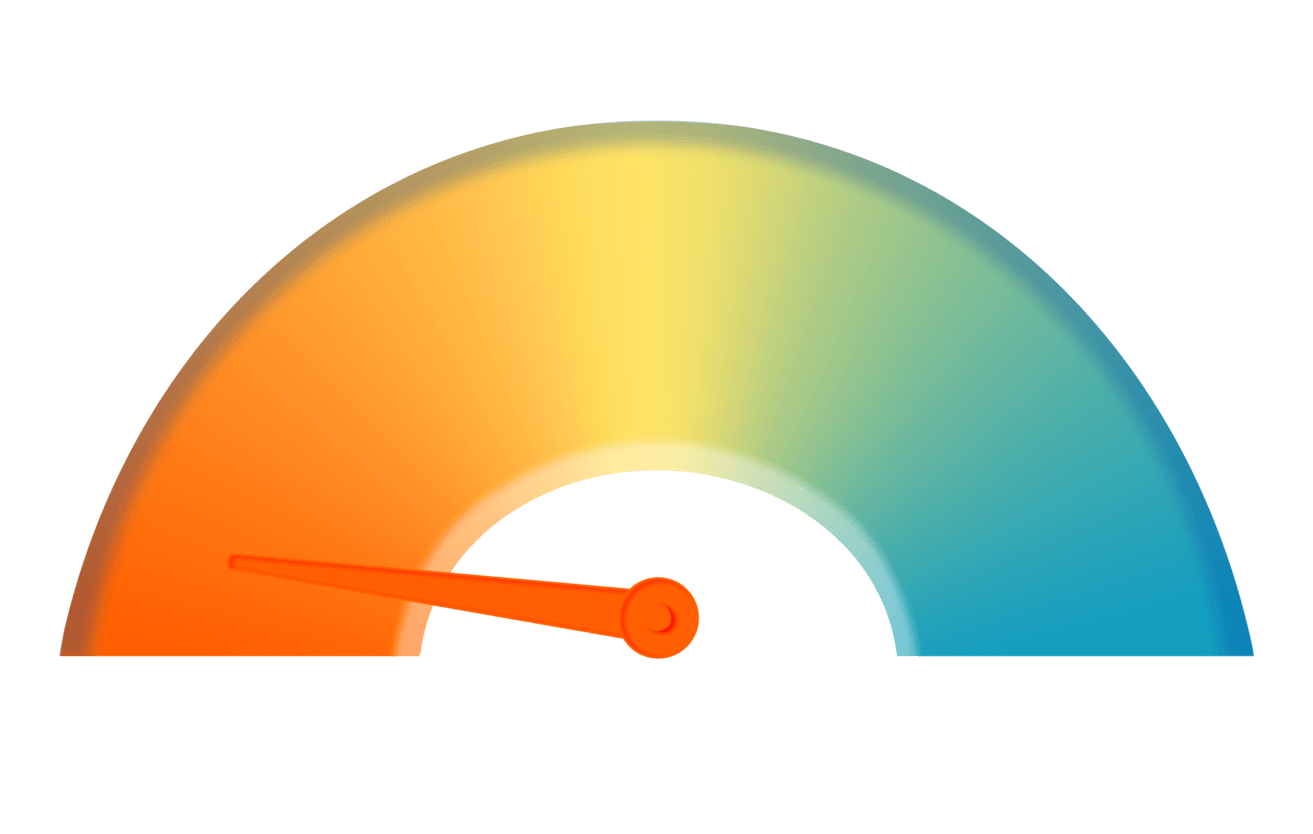
Underwater (Low Efficiency)
Score Range: 0-10
Work is fragmented and heavily manual. Tasks pile up, and teams spend more time
reacting than progressing.
Inconsistent
Score Range: 11-14
Some processes run smoothly while others break down. Results depend on workarounds, individual effort, and tribal knowledge.
Getting By
Score Range: 15 – 18
A basic foundation exists. Work moves forward, but friction appears in handoffs, repeated tasks, and unclear ownership.
Pretty Good
Score Range: 19–22
Processes are mostly integrated and predictable. Teams operate efficiently, with
occasional pockets of manual effort.
Harmonious (High Efficiency)
Score Range: 23 – 30
Operations are aligned and proactive. Manual work is rare, and teams can focus on
optimization rather than maintenance.
Manual data entry — retyping test results, claims, or contact forms
Approval queues — simple decisions that take days to move
More process hotspots revealed in your full report
Reducing a single high-drudgery workflow can cut processing time by up to 30%
Teams with low drudgery report 12% higher satisfaction
Industry-specific proof points available in your report.
Identify one process that crosses three or more teams
Your full action plan ranks the top five opportunities by ROI.