Your Personalized Drudgery Index Report

A complete breakdown of where inefficiency creates friction—and how to reduce it.
Report Overview
What is Drudgery?

Drudgery is the accumulated friction inside an organization. It’s the repetitive tasks, disconnected systems, bottlenecked workflows, and unclear ownership that slow teams down. It’s the hidden operational tax that drains productivity, lowers morale, and increases the cost of getting work done.

Why A Drudgery Index?

The Drudgery Index measures the degree of operational friction and overall process cohesion across three dimensions: system sprawl, manual work, cultural alignment. It provides a clear, data-driven snapshot of where work breaks down and where modernization, automation, or alignment can unlock the most impact.

What This Report Measures

This report provides a detailed look at your overall Drudgery Index results with a breakdown for each dimension. For each area, you’ll see what your score means, the leadership priorities that matter most, and the AI and automation opportunities that can create immediate impact.
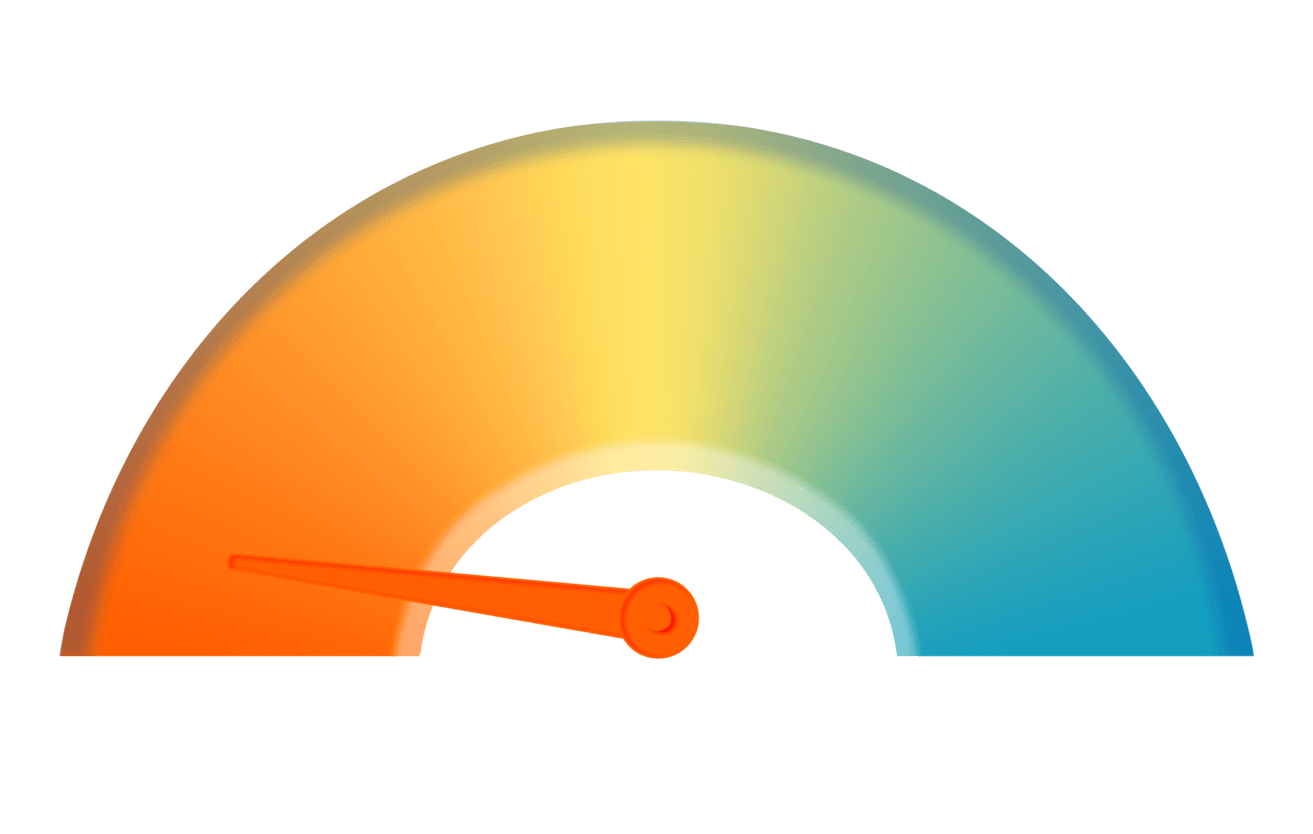
Your Scores At A Glance
Drudgery Zone
Underwater
Overall
0
out of 30
The strength of your operational foundation.
System Sprawl
0
out of 10
How well systems and workflows connect.
Manual Work
0
out of 10
The amount of repetitive, low-value effort.
Culture
0
out of 10
How alignment and ownership shape execution.
Overall Score & Drudgery Zone
The Overall Score reflects how well your processes, technology, and teams work together as a system. It captures the balance (or imbalance) between structure, clarity, and operational flow. Strong performance here typically indicates organizational readiness for scale; lower scores point to inconsistent execution and fragmented decision-making.
What this means

Workflows are fragmented, accountability is inconsistent, and people rely on manual effort to keep things moving. Systems don’t talk, reporting is painful, and burnout is high.

Leadership Priorities

Start simple and visible. Launch a “process rescue” initiative focusing on 2–3 high-friction areas. Empower employees to identify what should be automated first.

System Sprawl Score & Drudgery Zone
Sprawl measures how many systems, workflows, and handoffs your organization relies on and how well they connect. High sprawl creates duplication, delays, and unreliable data. Lower sprawl reflects tighter orchestration and smoother flow across teams.
What this means

Leadership Priorities

Manual Work Score & Drudgery Zone
Manual Work reflects the volume of repetitive tasks required to keep operations moving. When manual effort is high, teams spend more time fixing errors or pushing work forward manually. Reducing manual work improves speed, accuracy, and team satisfaction.
What this means

Leadership Priorities

Culture Score & Drudgery Zone
Culture captures how alignment, ownership, and expectations influence the pace and quality of work. Strong cultural alignment enables fast decisions and consistent follow-through. Weak alignment creates friction, rework, and stalled initiatives.
What this means

Leadership Priorities